Bassa LGA Rapid Household Needs Assessment – Plateau State
Content
- Executive summary
- Introduction and objectives
- Methodology
- Sample profile and coverage
- WASH and health findings
- Peacebuilding and social cohesion
- Protection and child protection
- Adolescent sexual and reproductive health
- Education
- Priority needs and cross-cutting analysis
- Data quality assessment
- Respondent voices
- Recommendations for Phase 1 programming
Annex A. Indicator summary table with confidence intervals Annex B. Ward-level data table
- Executive Summary
Between 17–24 September 2026, ALSARS enumerators conducted a household needs assessment across five wards of Bassa Local Government Area, Plateau State, Kimakpa, Zobwo, Gabia, Ta’agbe and Tahu to inform Phase 1 programming in WASH/health, peacebuilding, protection, adolescent sexual and reproductive health (SRHR), and education. Of 514 interviews attempted, 504 households consented and were assessed (10 declined and were not interviewed further), covering an estimated 4,175 people.
The assessment points to a population under sustained, compounding stress rather than a single dominant deficit:
- Water, sanitation and health access are weak across the LGA: only 34% of households use an improved drinking-water source, 76% practice open defecation, and just 15% have a handwashing facility with water and soap/ash at home. 88% of households reported a disease outbreak in the last 12 months, and outbreak reports are significantly more common where water and sanitation conditions are poorer.
- Conflict exposure is widespread and recent: 92% of communities reported conflict or violence in the last 12 months, most often banditry/armed attacks (82% of exposed communities), alongside farmer–herder and ethnic/religious conflict. Despite this, most respondents rate relations with neighboring communities as “fair” or “good”, and traditional dispute-resolution mechanisms are widely reported (93%).
- Protection risks are reported almost universally: child marriage (94%), gender-based violence (87%) and child labor (80%) were each flagged in the large majority of communities, yet only 45% of respondents know where a GBV survivor can get help and only 48% report safe spaces or services for women and children.
- Adolescent SRHR access is limited and highly uneven: 52% of households with adolescent’s report SRHR information/service access and 45% report menstrual hygiene support, with cost (87%) and a lack of youth-friendly services (68%) the leading barriers.
- Education infrastructure is under strain: 63% of households report the nearest school is damaged or needs repair. Among households with school-age children, an estimated 65% of school-age children are currently attending; school-fee cost (97%) is by far the most
cited reason children are out of school, and 60% of households report specific barriers to girls’ attendance.
- When asked to name the three most urgent needs, households ranked WASH/health/outbreak prevention (80%) and Education (76%) highest, ahead of peacebuilding (55%), protection (53%) and adolescent SRHR (23%). For future phases, food security/livelihoods, agriculture and economic empowerment dominate.
Needs are not evenly spread across the LGA: Kimakpa and Gabia report markedly better water access and lower open-defecation rates than Ta’agbe, Tahu and Zobwo, while Zobwo and Gabia report the longest travel times to a functioning health facility. Female-headed households and displaced/returnee households consistently report worse outcomes on several indicators (Section 10).
A data-quality caveat is central to this report and should inform how the findings are used (Section 11).
Several indicators, particularly on peacebuilding, protection, GBV-service knowledge and SRHR vary far more between individual enumerators than would be expected from genuine differences between the communities they covered, including in wards where two enumerators worked side by side. Interview durations for a large share of records are also implausibly short or long, and GPS clustering suggests some point locations may not reflect distinct household visits. This does not mean the findings are unusable, but it does mean ward- and enumerator-level breakdowns of the social/protection indicators should be treated as indicative rather than precise, and a light data-verification exercise is recommended before the results are used to size a budget or set hard targets.
2. Introduction and Objectives
ALSARS (Anchor for Life Support & Resilience) is designing a Phase 1 programme in Bassa Local Government Area (LGA) spanning five thematic areas: WASH/health and outbreak prevention, peacebuilding and social cohesion, protection (including gender-based violence and child protection), adolescent sexual and reproductive health (SRHR), and education. To ground this design in current household-level evidence, ALSARS commissioned a rapid household needs assessment covering the wards of Kimakpa, Zobwo, Gabia, Ta’agbe and Tahu.
The specific objectives of the assessment were to:
- Establish baseline indicators of WASH access, health-facility access and recent disease-outbreak experience;
- Document community-level exposure to conflict and the state of local peacebuilding and dispute-resolution structures;
- Identify protection risks affecting women, girls and children, and the availability of response services;
- Assess adolescents’ access to SRHR information, services and menstrual hygiene support;
- Assess school condition, attendance and barriers to education, particularly for girls;
- Understand which needs households themselves consider most urgent, to inform the prioritization and sequencing of Phase 1 activities.
This report presents the findings by thematic area, disaggregated by ward and by household characteristics (displacement status, female headship) where the data support it, and closes with a set of programming recommendations. A dedicated data-quality section (Section 11) sets out the limitations that should be borne in mind when the findings are used.
3. Methodology
3.1 Instrument and mode
Data were collected using a structured household questionnaire administered on mobile devices (ODK/Kobocollect), covering household demographics; WASH access; health-facility access and recent outbreak experience; conflict exposure and peacebuilding; protection risks (including GBV and child protection); adolescent SRHR; education; and household-perceived priority needs. The questionnaire combined single-select, multiple-select and open-text items, and captured a GPS location and, for most households, a photograph of the compound or site.
3.2 Coverage and timing
Fieldwork ran from 17–24 September 2026. 514 interviews were attempted; 504 households gave consent and were assessed, and 10 declined consent and were excluded from analysis. Five enumerators collected the bulk of the data, deployed across the five target wards (a small number
of records could not be attributed to a valid, identifiable enumerator name and are flagged separately in Section 11).
3.3 Analysis approach
All percentages in this report are calculated on the number of households that answered the relevant question (the denominator, n, is stated with each figure and table), not on the full sample of 504, because item non-response ranged from 0 to roughly 8% depending on the question. Multiple-select questions (e.g. barriers, protection risks) allowed more than one answer per household, so percentages in those charts sum to more than 100%. Where a comparison between two groups is described as statistically significant, this refers to a chi-square test at the 5% level; p-values are reported so readers can judge the strength of evidence themselves. 95% confidence intervals (Wilson method) for every headline indicator are provided in Annex A so that small-sample estimates (e.g. IDP households, n=24) are not over-interpreted.
3.4 Ethics and consent
Enumerators sought verbal consent before proceeding with each interview; households that declined were thanked and not interviewed further. Respondents were informed that information would be kept confidential and used only for planning purposes. GPS coordinates and photographs were collected for site verification and are not reproduced at household level in this report.
4. Sample Profile and Coverage
The 504 assessed households were spread across five wards, with Kimakpa contributing the largest share of the sample (191 households, 38%) and Tahu the smallest of the five main wards (69, 14%). Two additional interviews were recorded under a ward code (“Buhit”) that does not appear elsewhere in the dataset and are excluded from ward-level breakdowns
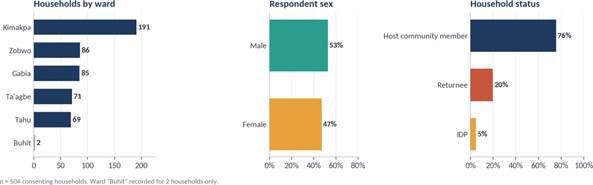
Figure 1. Sample distribution by ward, respondent sex and household displacement status.
Respondents were fairly evenly split by sex (53% male, 47% female). The large majority of households are long-standing host-community members (76%), with returnees (20%) and internally displaced households (5%) forming smaller but programmatically important sub-groups concentrated in particular wards (see Section 10).
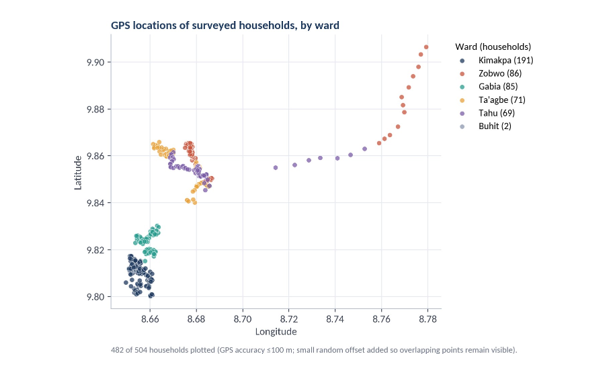
Figure 2. GPS locations of surveyed households, coloured by ward (small random offset applied for visibility).
The five wards form geographically distinct clusters, with Kimakpa and Gabia lying south of Zobwo, Ta’agbe and Tahu. 22 household records were excluded from the map owing to a missing or low-precision (>100 m) GPS reading; this does not affect the ward totals, which are based on the recorded ward name.
4.1 Household composition
The 504 households cover an estimated 4,175 people, a mean of 8.3 people per household (median 8). Children under 5 make up an estimated 21% of household members and adolescents (10–19) a further 31%, underlining the young age profile of the assessed population. An estimated 4.6% of household members are reported to have a disability.
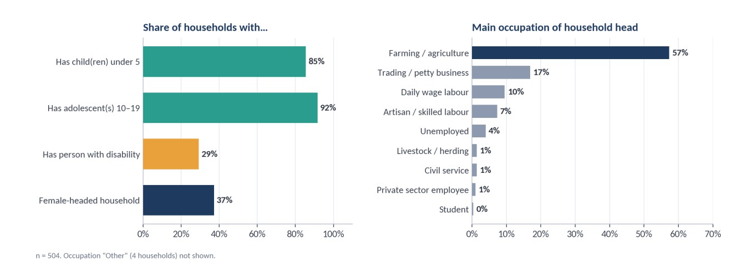
Figure 3. Share of households with children under 5, adolescents, a person with disability, or female headship (left); main occupation of the household head (right).
Farming/agriculture is the dominant livelihood, reported by 57.3% of households, far ahead of trading (16.9%) and daily wage labour (9.5%) a livelihood profile that is highly exposed to the conflict and climate-related shocks discussed in Sections 6 and 10.
5. WASH and Health Findings
5.1 Drinking water
Only 34% of households rely on an improved drinking-water source (borehole/handpump, protected well or piped supply). The remaining 66% depend on a stream, river or dam (44% of
households the single largest category) or an unprotected well (22%), both of which carry a high risk of contamination.
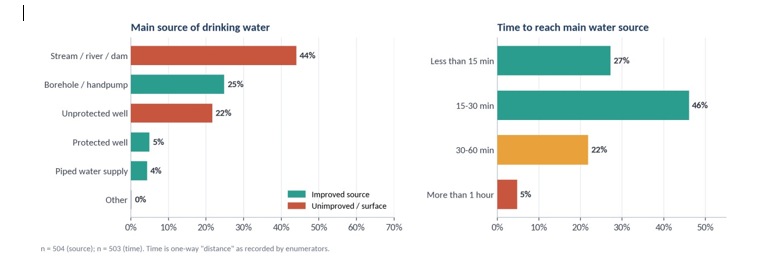
Figure 4. Main source of drinking water (left) and one-way time to reach it (right).
Water collection is also time-consuming: 22% of households report 30–60 minutes and a further 5% report over an hour to reach their main water source, time typically borne by women and girls and time that competes directly with schooling and income-generating activity.
5.2 Sanitation and hygiene
Sanitation coverage is very low: 76% of households report no toilet facility at all and practise open defecation, and only 15% of households have a handwashing facility with both water and soap or ash available at home.
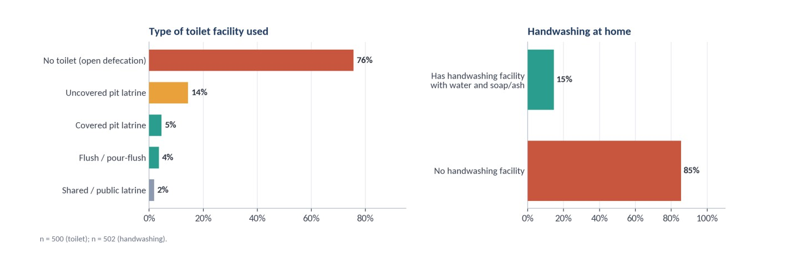
Figure 5. Type of toilet facility used (left) and availability of a handwashing facility at home (right).
5.3 Health-facility access and outbreak experience
A functioning health facility is more than an hour away for 25% of households, and a further 22% report 30–60 minutes; taken together, 47% of households are 30 minutes or more from care. Cost of services or medicine is by far the most commonly cited barrier to accessing healthcare (90%), followed by distance to the facility (50%) and lack of staff or drugs (47%).
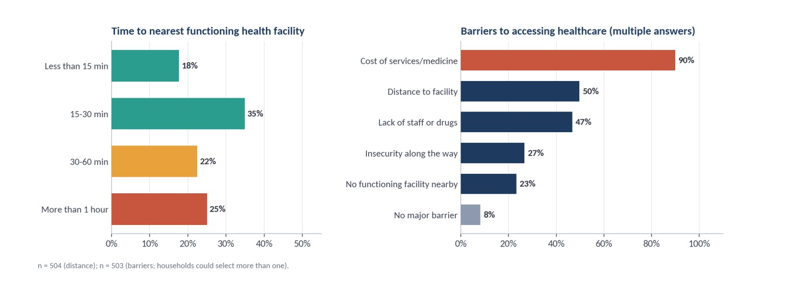
Figure 6. Time to the nearest functioning health facility (left) and barriers to accessing healthcare (right; households could select more than one barrier).
88% of households report a disease outbreak (e.g. cholera, measles) in the last 12 months an unusually high figure that is consistent with the weak water and sanitation coverage described above. Outbreak reports are significantly more common among households using an unimproved water source (93% vs 79% among those with an improved source, p < 0.001) and among households practicing open defecation (92% vs 78%, p < 0.001). The handwashing comparison points the same direction but is not statistically significant at this sample size (p = 0.112).
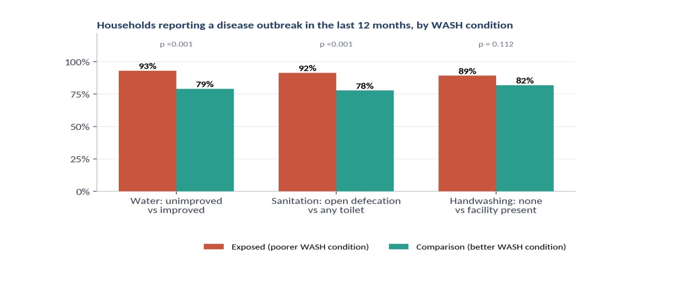
Figure 7. Share of households reporting a disease outbreak in the last 12 months, by WASH condition.
Implication: the combination of near-universal reliance on unimproved water, very low sanitation coverage, and a strong, statistically significant association with reported outbreaks makes WASH/health the single most evidence-backed priority in this assessment consistent with households’ own ranking of it as the top urgent need (Section 10).
6. Peacebuilding and Social Cohesion
92% of communities report having experienced conflict or violence in the last 12 months a strikingly high figure for what is nominally a “Phase 1” host-community and return area. Among those exposed, banditry/armed attacks is the most frequently reported form (82%), followed by farmer–herder conflict (54%) and ethnic/religious conflict (50%); many households selected more than one type, suggesting overlapping conflict dynamics rather than a single driver.
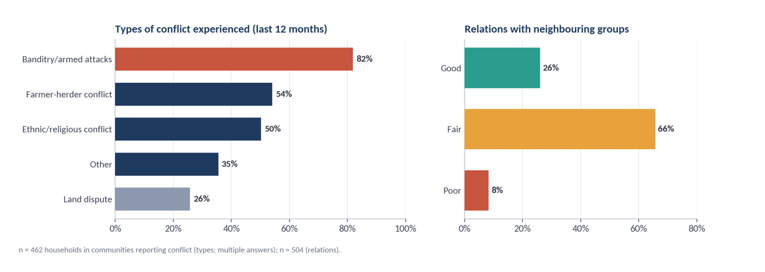
Figure 8. Types of conflict experienced in the last 12 months (left; multiple answers allowed) and reported relations with neighbouring communities/groups (right).
Despite this exposure, most households describe relations with neighbouring communities/groups as “fair” (66%) or “good” (26%), with only 8% rating them “poor” suggesting that conflict is experienced more as external/security-driven violence than as a breakdown in inter-communal relations per se.
6.1 Existing peace and cohesion structures
A large majority of communities report having a traditional or community-based mechanism for resolving disputes (93%), and most report that women and youth participate in peacebuilding and community decision-making (77%). These are meaningful assets: any peacebuilding programming has real local structures to work through and strengthen rather than needing to build cohesion mechanisms from nothing.
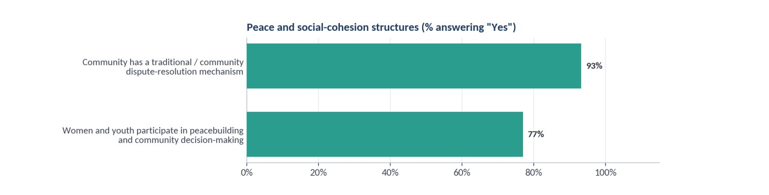
Figure 9. Reported presence of dispute-resolution mechanisms and inclusive participation in community decision-making.
A number of open-ended comments reinforce this picture directly, with several respondents naming peace itself as the community’s central need (see Section 12).
7. Protection and Child Protection
Reported protection risk levels are very high across the LGA. Child marriage (94%) and gender-based violence (87%) were each flagged by close to nine in ten communities, and child labour by 80%; abduction/kidnapping was reported by 34%. Only 4% of households reported no protection risks in their community.
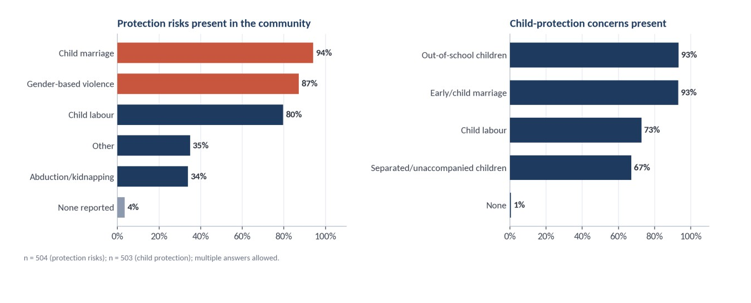
Figure 10. Protection risks present in the community (left) and child-protection concerns present among children in the household/community (right); multiple answers allowed.
At the child level, out-of-school status (93%) and early/child marriage (93%) are the most frequently reported concerns, followed by child labour (73%) and separated/unaccompanied children (67%), pointing to overlapping protection and education vulnerabilities in the same households.
7.1 Response services and awareness
Awareness of, and access to, response services lags far behind the scale of reported risk: only 45% of respondents know where a survivor of GBV can go for help, and only 48% report that safe spaces or services for women and children exist in their community. This gap between risk prevalence (universal) and service knowledge/availability (under half) is one of the clearest programming signals in the assessment.
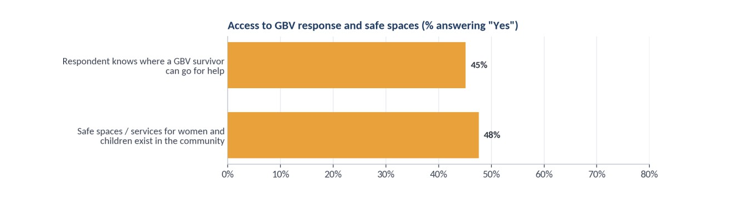
Figure 11. Respondent awareness of GBV referral pathways and reported availability of safe spaces/services.
8. Adolescent sexual and reproductive health (SRHR)
Among households with adolescents, 52% report that adolescents have access to SRHR information or services, and 45% report that adolescent girls have access to menstrual hygiene items or support both close to a coin flip, and both well behind the near-universal protection-risk reporting in Section 7.
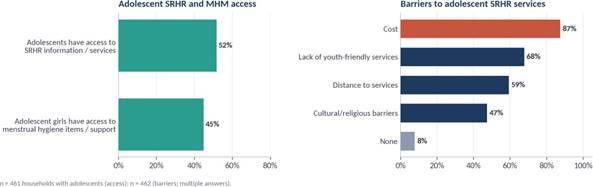
Figure 12. Adolescent SRHR and menstrual hygiene management (MHM) access (left) and reported barriers to adolescent SRHR services (right; multiple answers allowed).
Cost is the dominant barrier (87%), followed by a lack of youth-friendly services (68%), distance to services (59%) and cultural/religious barriers (47%). Only 8% of households report no barrier at all.
9. Education
Nearest-school condition is a serious concern: 63% of households report that the nearest school is damaged or needs repair, and a further 10% report no school nearby at all meaning fewer than three in ten households (27%) have access to a normally functioning school nearby.
Among 422 households that reported a consistent number of school-age (6–17) children and children currently attending, an estimated 1,395 children of school age are reported, of whom 905 (65%) are currently attending school; 262 of these households (62%) have at least one child currently out of school. A further 58 household records report more children “attending” than the stated number of school-age children and were excluded from this calculation as internally inconsistent (see Section 11).
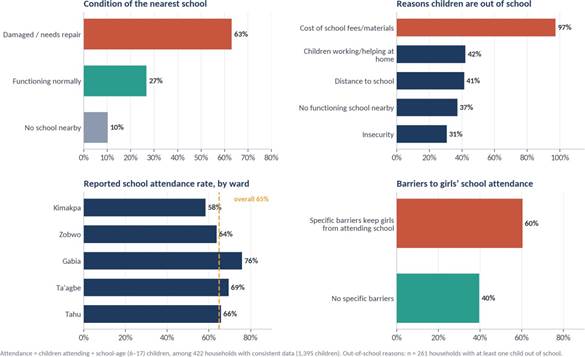
Figure 13. Nearest-school condition; reasons children are out of school; reported attendance rate by ward; and barriers to girls’ attendance.
Cost of school fees/materials is overwhelmingly the leading reason children are out of school (97% of households with an out-of-school child), well ahead of children working/helping at home (42%), distance to school (41%) and no functioning school nearby (37%). Reported attendance is lowest in Kimakpa (58%) and highest in Gabia (76%), a pattern worth cross-checking against the “no school nearby” and school-condition responses for those wards. 60% of households report specific barriers that keep girls from attending school, meaning girls’ education access should be treated as a distinct sub-issue within the wider education response, not assumed to move automatically with general access improvements.
10. Priority needs and cross-cutting analysis
10.1 Self-reported urgent needs
Households were asked to name the three most urgent needs for their household/community from the five Phase 1 thematic areas (plus “Other”). WASH/health/outbreak prevention (80%) and Education (76%) were named far more often than the other three areas, with Peacebuilding (55%)
and Protection/GBV/Child protection (53%) roughly tied in third and fourth place, and Adolescent SRHR (23%) ranked lowest of the five not because it is unimportant (Section 8 shows real unmet need) but because it competes for attention against more immediately felt problems.
When asked about needs beyond the five Phase 1 areas, for future programming phases, economic empowerment (96%), food security/livelihoods (83%) and agriculture (81%) dominate consistent with farming being the main livelihood for the large majority of households (Section 4.1) and with conflict-driven disruption of farming and market access (Section 6).
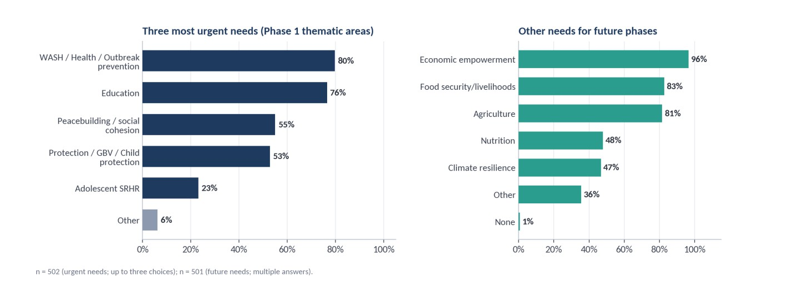
Figure 14. Three most urgent needs among the five Phase 1 thematic areas (left) and other needs named for future programming phases (right).
10.2 Ward-level variation
The heat map below brings together the report’s core indicators by ward. Two patterns stand out. First, Kimakpa and Gabia perform markedly better on WASH access (improved water, lower open defecation) than Ta’agbe, Tahu and Zobwo, which is consistent with those two wards’ lower reported urgency of WASH as a top-3 need. Second, the social/protection indicators (peacebuilding participation, GBV-service knowledge, SRHR access) show an extremely sharp Kimakpa/Gabia-vs-rest split that is larger than the WASH gap and, as discussed in Section 11, coincides closely with which enumerator worked which ward so this particular pattern should be treated with more caution than the WASH pattern, which is corroborated by the independent, objective outbreak-association analysis in Section 5.3.
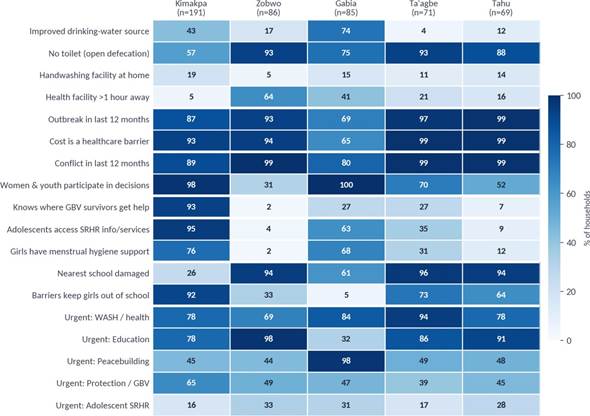
Figure 15. Ward-level indicator summary (% of households; n per ward shown in column headers).
10.3 Displacement status
Host-community, returnee and IDP households show statistically significant differences on several indicators. IDP and returnee households are far less likely to use an improved water source (13% and 12% respectively, vs 41% for host-community households; p < 0.001), more likely to practice open defecation (92% of returnees vs 71% of host-community households; p < 0.001), and more likely to report the nearest school as damaged (94%–83% vs 54%; p < 0.001). Both groups also rank Education as an urgent need more often than host-community households (p < 0.001).
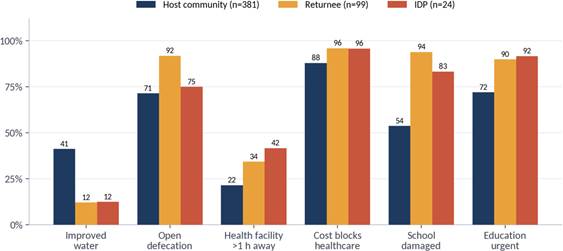
Figure 16. Selected WASH, health and education indicators by household displacement status.
These gaps suggest that a purely ward-based targeting approach could under-serve displaced and returnee households where they are a minority within a better-off host community, and that household displacement status is worth tracking as a distinct targeting criterion alongside ward geography.
10.4 Female-headed households
Female-headed households (37% of the sample) report significantly worse outcomes on several protection- and access-related indicators: they are more likely to have a household member with a disability (40% vs 23%; p < 0.001), more likely to cite cost as a healthcare barrier (97% vs 85%; p < 0.001), more likely to know where a GBV survivor can get help (60% vs 36%; p < 0.001) plausibly reflecting greater personal salience of the issue rather than better service coverage and more likely to report specific barriers to girls’ school attendance (77% vs 50%; p < 0.001). Female-headed households are also somewhat less likely to use an improved water source (26% vs 39%; p = 0.006) and more likely to rank Protection/GBV/child protection as an urgent need (p = 0.004).
Taken together, Sections 10.3 and 10.4 indicate that displacement status and female headship are each independently associated with worse outcomes on multiple indicators, and both should be used as targeting/vulnerability criteria within wards, not only ward of residence itself.
11. Data quality assessment
This section sets out the checks run on the raw dataset and what they mean for how confidently the findings above can be used. None of the issues below invalidate the assessment, but several are large enough that ward- and enumerator-level comparisons on the social/protection/SRHR indicators in particular should be treated as indicative rather than precise, pending a light verification exercise.
11.1 Enumerator naming and completeness
Enumerator names were entered as free text rather than selected from a list, producing 15 distinct spellings/variants for what appear to be five actual people (e.g. “Jessica Sunday” / “Jessica Sunday “, “Grace Redzie Sunday” / “Grace Redzie sunday” / “Greca Redzie Sunday”). These have been consolidated into five enumerators for this report; two records used clearly invalid names (“Hdhd”, “4”) and could not be attributed with confidence they are retained in the analysis but excluded from all enumerator-level breakdowns. Standardizing enumerator identity to a dropdown list in the next data-collection round would remove this issue entirely.
11.2 Interview duration
Interview duration (end minus start time) ranges from under 3 minutes to over 27 hours, which is not itself meaningful long gaps typically reflect a device being left open between visits rather than a 27-hour interview. As a simpler check, 26 interviews (5%) were completed in under 5 minutes for a questionnaire that covers demographics, WASH, health, conflict, protection, SRHR, education and priority needs plausible only if answered very quickly, and worth spot-checking against the underlying paper/photo evidence where available. Median duration also differs sharply by enumerator (from around 17 minutes for two enumerators to well over an hour for two others), which is consistent with, but does not on its own prove, differences in interview thoroughness.
11.3 Internal consistency of numeric answers
Household roster figures are internally consistent in the great majority of cases (children under 5, adolescents and persons with disability essentially never exceed total household size). The one area of concern is the school-attendance pair: 58 household records (12%) report more children “currently attending school” than the stated number of “school-age children in the household” a
logical impossibility that most likely reflects a data-entry slip (the two fields being swapped, or “attending” being read as “ever enrolled”). These records were excluded from the school-attendance-rate calculation in Section 9 rather than guessed at, which is why that calculation uses a denominator of 422 households rather than the full 469 households with school-age children.
11.4 GPS coverage and clustering
GPS coordinates were captured for 504 of 504 households; 12 records have a recorded accuracy worse than 100 m and 10 fall outside the main cluster of points and were excluded from the map in Figure 2 for legibility. Within wards, points cluster more tightly than would be expected from 504 genuinely independent household compounds spread across a rural ward for example, in Kimakpa the median distance between the nearest points recorded by two different enumerators is well under half a kilometre. This pattern is consistent with either a genuinely nucleated settlement pattern (several households sharing a compound or a small trading-centre layout) or with some interviews being conducted from a small number of fixed vantage points; the assessment data alone cannot distinguish between these, and it would be worth checking against the household photographs or with the enumerators directly.
11.5 Consistency across enumerators the main caveat
The most material finding in this section is that several indicators vary far more by enumerator than would be expected if enumerators were simply reporting what different but broadly similar communities told them. Table 1 focuses on the clearest case: Kimakpa ward, where two enumerators worked concurrently and interviewed broadly overlapping neighbourhoods (median distance between their nearest recorded points is under 400 m), so their results should, in principle, be similar.
| Indicator | Enumerator A (n=100) | Enumerator B (n=80) | Gap |
| Women & youth participate in decision- making | 100% | 96% | 4 pts |
| Knows where GBV survivors can get help | 99% | 92% | 7 pts |
| Safe spaces for women & children exist | 98% | 33% | 66 pts |
| Adolescents have SRHR information/services access | 98% | 96% | 1 pts |
| Nearest school damaged / needs repair | 3% | 53% | 50 pts |
| Specific barriers keep girls out of school | 99% | 95% | 4 pts |
| Household has ≥1 person with disability | 18% | 87% | 70 pts |
Table 1. Same-ward comparison: two enumerators working in Kimakpa (n=100 and n=80). Because both covered the same ward at the same time, large gaps here are more likely to reflect differences in how the question was asked or recorded than genuine differences between the households visited.
A similar pattern, though smaller in absolute size, appears between the two enumerators who split Ta’agbe/Tahu/Zobwo between them (Figure 17): on peacebuilding participation, GBV-service knowledge, SRHR access and disability reporting, one enumerator’s households answer close to uniformly one way and the other’s close to uniformly the other way, across three different wards. Several of these same indicators (dispute-resolution mechanism, women/youth participation, GBV-service knowledge, safe spaces, SRHR access) also show one or more enumerators recording “Yes” on nearly every household interviewed, which is the pattern a straight-lining or leading-question issue would produce, though it could equally reflect a genuinely more socially cohesive area that same enumerator happened to cover.
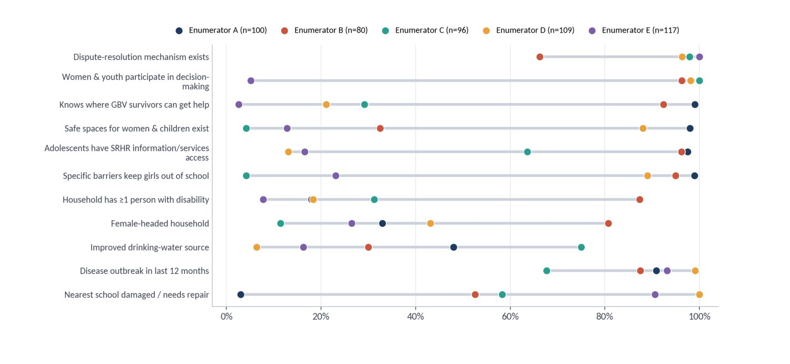
Figure 17. Range of responses to eleven social/protection/SRHR/education indicators, by enumerator (each dot is one enumerator’s rate on that indicator; the grey line spans the full range observed).
What this means for using the report: the WASH/health findings in Section 5 are corroborated by an independent, objective association (outbreak history tracking measured water/sanitation conditions, Figure 7) and by consistent patterns across enumerators, and can be used with normal confidence. The peacebuilding, protection, GBV-service and SRHR indicators in Sections 6–8, and the ward-level social-indicator rows in the Section 10.2 heat map, are more likely to be partly driven by who asked the question rather than purely by underlying conditions, and should be treated as showing real, large problems exist rather than as precise figures: for several of them the gap between the lowest and highest enumerator (Figure 17) is so wide that the true LGA-level value cannot be pinned down from this dataset alone. Before these specific indicators are used to set ward-level targets or a budget split, ALSARS may want to: (a) re-verify a small random sample of records with a second enumerator or supervisor, (b) review whether the questionnaire’s protection/SRHR items were asked and recorded consistently (e.g. read exactly as worded vs paraphrased), and (c) consider standardizing enumerator identity capture and adding light server-side duration/consistency checks in Kobo for future rounds.
12. Respondent voices
385 of 504 households left a closing comment. Most (279) were brief acknowledgements (“No”, “Thank you”) with no substantive content; 106 contained a more developed message. Recurring themes among these are summarized below, with illustrative examples paraphrased rather than quoted directly to protect respondent confidentiality.
| Theme | Households |
| Expressions of thanks / goodwill toward the assessment | 97 |
| Direct requests for ALSARS to provide assistance | 28 |
| Peace, safety and security as the core concern | 11 |
| Livelihoods, jobs and financial support | 8 |
| Safe/clean water specifically | 3 |
| Youth engagement | 2 |
| Concern about past assessments with no follow-up | 5 |
Table 2. Approximate themes in substantive closing comments, identified by keyword matching (a comment may touch more than one theme; counts are indicative, not a formal coding).
A small number of respondents referenced specific, severe experiences a vehicle burned in an attack, a household living in what the respondent described as ongoing danger despite not retaliating that corroborate the conflict-exposure findings in Section 6 at the level of lived experience.
An accountability signal worth flagging directly: a small number of respondents noted, in substance, that this is not the first assessment their community has taken part in and that previous engagements did not visibly lead to assistance. Whatever Phase 1 activities are ultimately funded, some visible, communicated follow-through even a simple community-level briefing on what was heard and what will happen next would directly address a concern respondents raised unprompted.
13. Recommendations
13.1 Sequencing and thematic priority
The evidence supports the household-stated priority order: WASH/health and Education first, with Peacebuilding, Protection/GBV and Adolescent SRHR integrated alongside rather than sequenced after, given how tightly protection and education vulnerabilities co-occur at household level (Section 7).
- WASH/health: prioritise improved water-source rehabilitation/construction and sanitation promotion in Ta’agbe, Tahu and Zobwo, where improved-water coverage is lowest and open defecation highest; pair any water intervention with hygiene promotion given the very low handwashing-facility coverage (15% LGA-wide) and the significant, measured association between poor WASH conditions and reported outbreaks.
- Education: combine a fee/cost-relief or cash-for-education mechanism (the dominant reason children are out of school) with school infrastructure repair, prioritising wards
with the highest “damaged/needs repair” rates; track girls’ attendance separately given the distinct barriers reported.
- Protection/GBV: the clearest signal is the gap between near-universal reported risk (child marriage, GBV, child labour) and limited awareness of referral pathways and safe spaces. However, reported GBV-service knowledge ranges from about 3% to 99% depending on the enumerator (Figure 17), so verify the true awareness level with a supervised sample re-survey before sizing referral-pathway or safe-space investments; a referral-mapping and awareness activity is a low-regret starting point either way.
- Peacebuilding: build on existing dispute-resolution mechanisms and women/youth participation rather than introducing new parallel structures; given the very high recent conflict exposure (banditry/armed attacks foremost), consider linking peacebuilding activities to livelihoods/economic-empowerment programming, which respondents themselves flagged as the top future-phase need and which is a recognised conflict-mitigation entry point in farmer–herder and banditry-affected contexts.
- Adolescent SRHR: address cost and the lack of youth-friendly service points as the two leading, and most directly actionable, barriers; consider bundling MHM support with existing school-based or health-facility touchpoints.
13.2 Targeting
- Use ward of residence as a first-cut targeting criterion for WASH/health and education infrastructure, informed by Section 10.2, but re-verify the social/protection indicators (Section 11.5) before using them to allocate a protection/peacebuilding budget by ward.
- Layer displacement status and female headship on top of ward geography as household-level vulnerability criteria (Section 10.3–10.4): both are independently associated with worse outcomes on multiple indicators, so a ward-only targeting rule risks under-serving these households where they are a minority within a better-off ward.
13.3 Data quality actions before finalising budgets or targets
- Re-verify a random sample of records (particularly from the enumerators identified in Section 11.5, and interviews under 5 minutes) against household photographs or via a supervisor call-back.
- Standardise enumerator identity capture (dropdown list, not free text) and add basic server-side logic checks in KoBo (e.g. attending ≤ school-age children) for the next round.
- Consider a brief supervisor debrief on how the protection/SRHR/peacebuilding questions were actually asked in the field, to distinguish genuine ward differences from interviewer effects.
- Close the feedback loop with surveyed communities on what was found and what will happen next, given the explicit concern some respondents raised about past assessments not leading to visible follow-up.
Annex A. Indicator summary table with confidence intervals
All indicators below are calculated on households that answered the relevant question(s); n is the denominator. 95% confidence intervals use the Wilson score method, which performs better than the simple normal approximation for proportions near 0% or 100% and for smaller samples.
| Indicator | k | n | % | 95% CI |
| Improved drinking-water source | 172 | 504 | 34.1% | 30.1–38.4% |
| Water source >30 min away | 134 | 503 | 26.6% | 23.0–30.7% |
| No toilet (open defecation) | 378 | 500 | 75.6% | 71.6–79.2% |
| Handwashing facility with water & soap/ash | 73 | 502 | 14.5% | 11.7–17.9% |
| Health facility >1 hour away | 126 | 504 | 25.0% | 21.4–29.0% |
| Health facility >30 min away | 239 | 504 | 47.4% | 43.1–51.8% |
| Disease outbreak in last 12 months | 444 | 503 | 88.3% | 85.2–90.8% |
| Cost cited as barrier to healthcare | 452 | 503 | 89.9% | 86.9–92.2% |
| Community experienced conflict (12 months) | 462 | 503 | 91.8% | 89.1–93.9% |
| Relations with neighbours rated poor | 42 | 504 | 8.3% | 6.2–11.1% |
| Dispute-resolution mechanism exists | 469 | 503 | 93.2% | 90.7–95.1% |
| Women & youth participate in decision-making | 388 | 504 | 77.0% | 73.1–80.4% |
| Knows where GBV survivors can get help | 227 | 503 | 45.1% | 40.8–49.5% |
| Safe spaces for women & children exist | 240 | 504 | 47.6% | 43.3–52.0% |
| Adolescents have SRHR information/services access | 238 | 461 | 51.6% | 47.1–56.2% |
| Adolescent girls have menstrual hygiene support | 207 | 461 | 44.9% | 40.4–49.5% |
| Nearest school damaged / needs repair | 316 | 501 | 63.1% | 58.8–67.2% |
| Specific barriers keep girls out of school | 303 | 502 | 60.4% | 56.0–64.5% |
| Household has ≥1 person with disability | 147 | 502 | 29.3% | 25.5–33.4% |
| Female-headed household | 187 | 502 | 37.3% | 33.1–41.6% |
| Top-3 urgent need: WASH / health / outbreak prevention | 400 | 502 | 79.7% | 75.9–83.0% |
| Top-3 urgent need: Education | 384 | 502 | 76.5% | 72.6–80.0% |
| Top-3 urgent need: Peacebuilding / social cohesion | 276 | 502 | 55.0% | 50.6–59.3% |
| Top-3 urgent need: Protection / GBV / child protection | 265 | 502 | 52.8% | 48.4–57.1% |
| Top-3 urgent need: Adolescent SRHR | 116 | 502 | 23.1% | 19.6–27.0% |
Annex B. Ward-level data table
Percentages of households answering “Yes” / in the stated category, by ward. See Section 11.5 for a caution on the social/protection/SRHR rows specifically.
| Indicator | Kimakpa (n=191) | Zobwo (n=86) | Gabia (n=85) | Ta’agbe (n=71) | Tahu (n=69) |
| Improved drinking-water source | 43% | 17% | 74% | 4% | 12% |
| No toilet (open defecation) | 57% | 93% | 75% | 93% | 88% |
| Handwashing facility with water & soap/ash | 19% | 5% | 15% | 11% | 15% |
| Health facility >1 hour away | 5% | 64% | 41% | 21% | 16% |
| Disease outbreak in last 12 months | 87% | 93% | 69% | 97% | 99% |
| Cost cited as barrier to healthcare | 93% | 94% | 65% | 99% | 99% |
| Community experienced conflict (12 months) | 89% | 99% | 80% | 99% | 99% |
| Women & youth participate in decision-making | 98% | 31% | 100% | 70% | 52% |
| Knows where GBV survivors can get help | 93% | 2% | 27% | 27% | 7% |
| Adolescents have SRHR information/services access | 95% | 4% | 63% | 35% | 9% |
| Adolescent girls have menstrual hygiene support | 76% | 2% | 68% | 31% | 12% |
| Nearest school damaged / needs repair | 26% | 94% | 61% | 96% | 94% |
| Specific barriers keep girls out of school | 92% | 33% | 5% | 73% | 64% |
| Top-3 urgent need: WASH / health / outbreak prevention | 78% | 69% | 84% | 94% | 78% |
| Top-3 urgent need: Education | 78% | 98% | 32% | 86% | 91% |
| Top-3 urgent need: Peacebuilding / social cohesion | 45% | 44% | 98% | 49% | 48% |
| Top-3 urgent need: Protection / GBV / child protection | 65% | 49% | 47% | 39% | 45% |
| Top-3 urgent need: Adolescent SRHR | 16% | 33% | 31% | 17% | 28% |
Report prepared by the ALSARS MEAL Unit · 25 September 2026 · Data source: Kobo household needs assessment export, Bassa LGA.